Hi guys,
As you probably have known for quite some time, Tableau 8.1 is released and a ton of cool features is available for us to utilize. However, I'd like to highlight some really nice new features that's been on our wishlist for some time. And here they are:
#1 Dashboard Transparency
Since tableau 8, we have been able to create floating items in our dashboards. Be it quickfilters, legends even text and logos. Its a wonderful feature, adding that free-form illusion to create a more immersed experience. However, one annoying problem is that the background color of these floating items cannot be transparent. Thus leaving us with a beautiful chart on a Map background only to be spoiled by ugly white backgrounds of the legends. With 8.1 we now can set transparent background for titles, legends and even images as long as the images have transparency. Unfortunately quickfilters are not included in this improvement, so let's hope they got it right on the next release.
#2 Full Screen Presentation Mode
Finally, that's all I can say. A lot of customers expect that the presentation mode would look like Powerpoint. And they are right to expect that. Its just so weird that Tableau took this long to come up with this feature. Anyway its here now and its just lovely. Reports can be more immersive and we can focus more on the presentation than get distracted with unnecessary controls.
 #3 Workbook to workbook copying
This is something that's immediately obvious but surprisingly you cannot do with previous versions of Tableau. Many a time where, you are working on a workbook, then you'd remember something you did at another workbook that you can use. Of course you'd try to copy a sheet from that workbook to the one you're working on, only to discover that it can't be done, and end up building the feature from scratch. I'm glad that this headache is finally over.
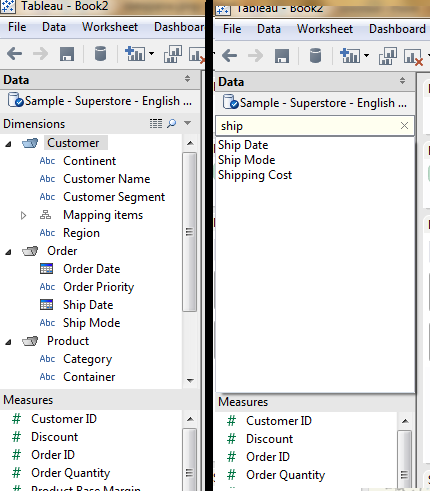
#4 Data Folders and Search
This feature isn't really obvious when you only work with a small data set. But some analysts require access to more than a hundred fields, so when something like that happens, it really helps to organize your data without affecting the content themselves. Another handy feature is the search option, when there are too many fields you need to use, and you are tired of scrolling and squinting your eyes to find particular field, with 8.1 this unnecessary process is eliminated.
#5 DATEPARSE Function
Tableau handles dates very well, that's a fact, but this comes with a small quirk, only a certain format of dates is accepted, lest your date data would become a jumbled mess. To handle this issue, we ususally have to create a calculated field and process the date manually from the string. This is OK if you have one date format, but with several, you'd have to settle with lines and lines of formula. With 8.1's DATEPARSE function, it really streamlines the date processing into a single function, just give the field name, the date formatting of the string and voila! the date is parsed and you can get on with your work.
#6 Quickfilter Apply
When you work with your workbook online either with a browser or mobile device, latency can sometimes be an issue. You love the fact that Tableau automatically refreshed your data when you use the quickfilters, but you'll be really annoyed when it does that all the time and with a slow connection, it gets even worse. Yes you have the :pause for automatic updates" button, but sometimes its too late when you remember to use it. On 8.1, having an "Apply" button on a quickfilter is really intuitive, enabling you to set whatever filtering you want to apply then query it in one shot.
#7 Draggable Quickfilter
With Tableau 8.1, you can do your work on your iPad or your Android tablets, cool, but one uncool thing is that when you are analyzing a Viz that too big of a size or when you'd want to zoom in to have clear view on a particular chart on a dashboard, you'd have to scroll back and forth between the filters and the chart. Enabling the quickfilters to be dragged really makes things easier, now you can analyze your data anywhere without sacrificing the experience you get from a desktop.

#8 Ranking
This is one of the few features that is simple and you'd expect to have in Tableau since early on. But what usually happens is you end up misjudging its simplicity and having calculated fields with lines and lines of formula just to get the ranking right. I'm so glad that this feature is finally here, and you can access it directly from the quick table calculation option. Cool :)
Of course guys there are more advances in Tableau 8.1, but the ones I mentioned, really hits the spot. So enjoy the new Tableau, and with 8.2 on the horizon, more features would come and more people can enjoy visualizing data with Tableau, especially Mac users <wink> <wink>.
If you have any questions on Tableau, or just need someone to show you around the software, feel free to contact us at
http://venturess.com.
See Ya


